library(tidyverse)Import Data
Did you start with a Project?
Reproducibility starts at the foundation! Always begin by opening a project. See New Projects for tips.
We recommend entering your code in code-chunks within coding notebooks.
In this workshop we recommend the Tidyverse approach to learning and using R
Below are some of the core tidyverse packages that are loaded with the function: library(tidyverse).
| package | use | package | use |
|---|---|---|---|
dplyr |
data wrangling | forcats |
categorical data / factors |
ggplot2 |
visualization | lubridate |
dates and times |
readr |
import CSV | stringr |
regular expressions / strings |
purrr |
iteration / functional programing | tidyr |
pivot data |
readxl |
import Excel files | haven |
import SPSS/Stata/SAS |
Data import wizard
The data import wizard is a quick and easy way to import your data
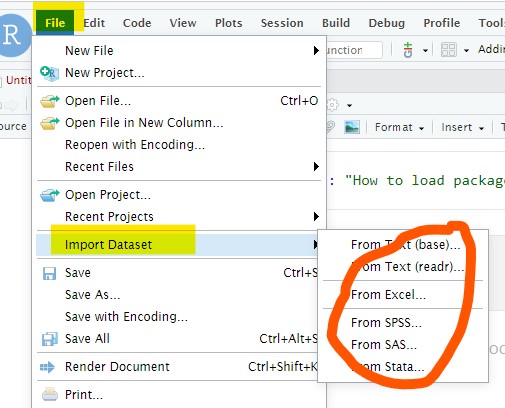
It’s actually way better to follow the reproducible steps – and hardly any more effort – below…
Load library packages
Open a Quarto document, Insert a code-chunk (Ctrl-Alt-I) and copy the following code. Then execute the code. You may first have to install the tidyverse-package if you have not already1.
Import data
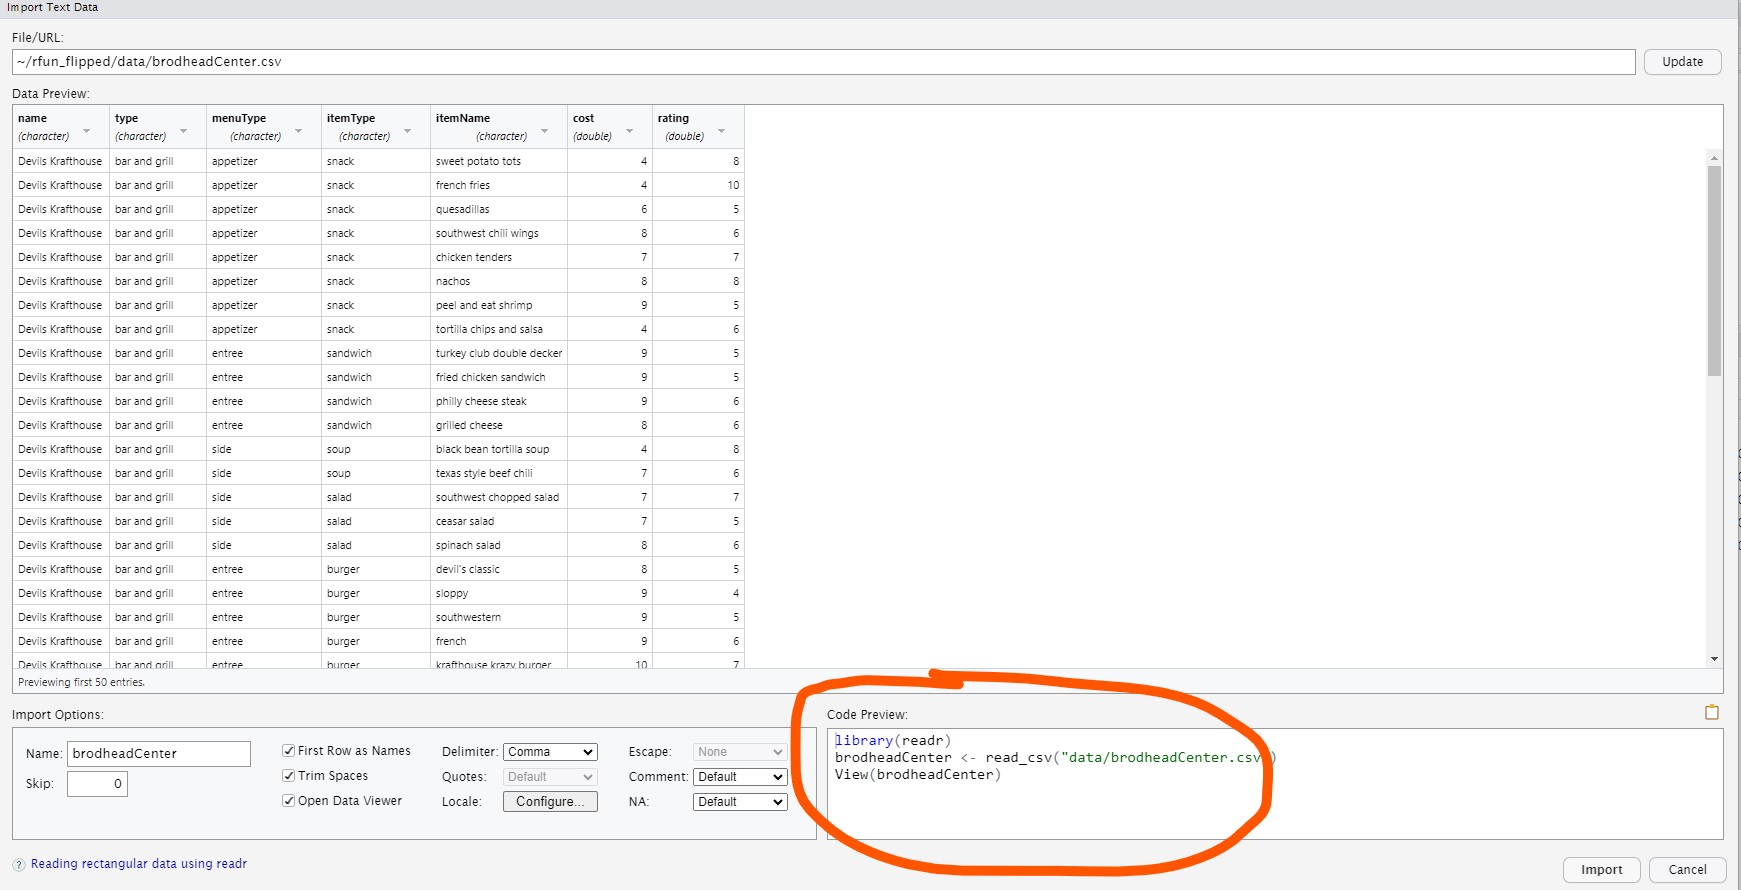
In RStudio, in the Files quadrant and tab, click the data folder, then left-click the brodhead_center.csv file. Using the context menu, choose the Import Dataset… option. Once inside the data wizard, you can copy the code int he code-preview window, then paste the code into the code chunk of your quarto document or r script.
# library(readr)
brodhead_center <- read_csv("data/brodhead_center.csv")
# view(brodheadCenter)
Composing the data import code…
Writing the import data function can be tricky. Try the import wizard pictured above. THEN, paste the code from the Code Preview section into your script.
Excel, SPSS, SAS, etc.
The data import wizard will help you find the proper package for importing your data. For example, use…
library(readxl)for Excel datalibrary(haven)for SPSS, SAS, Statalirary(readr)for CSV or other delimeters
Just start with File > Import Dataset to get started composing that code, then paste your code into a script.
Look at the data object
Now that you’ve assigned the output from the read_csv function to the name brodhead_center, simply call that object name in a code chunk.
brodhead_centerVisualize your data with {ggplot2}
Here’s a quick teaser on visualizing data. Read more in the visualization chapter.
brodhead_center |>
  ggplot(aes(x = name, y = cost)) +
geom_boxplot() 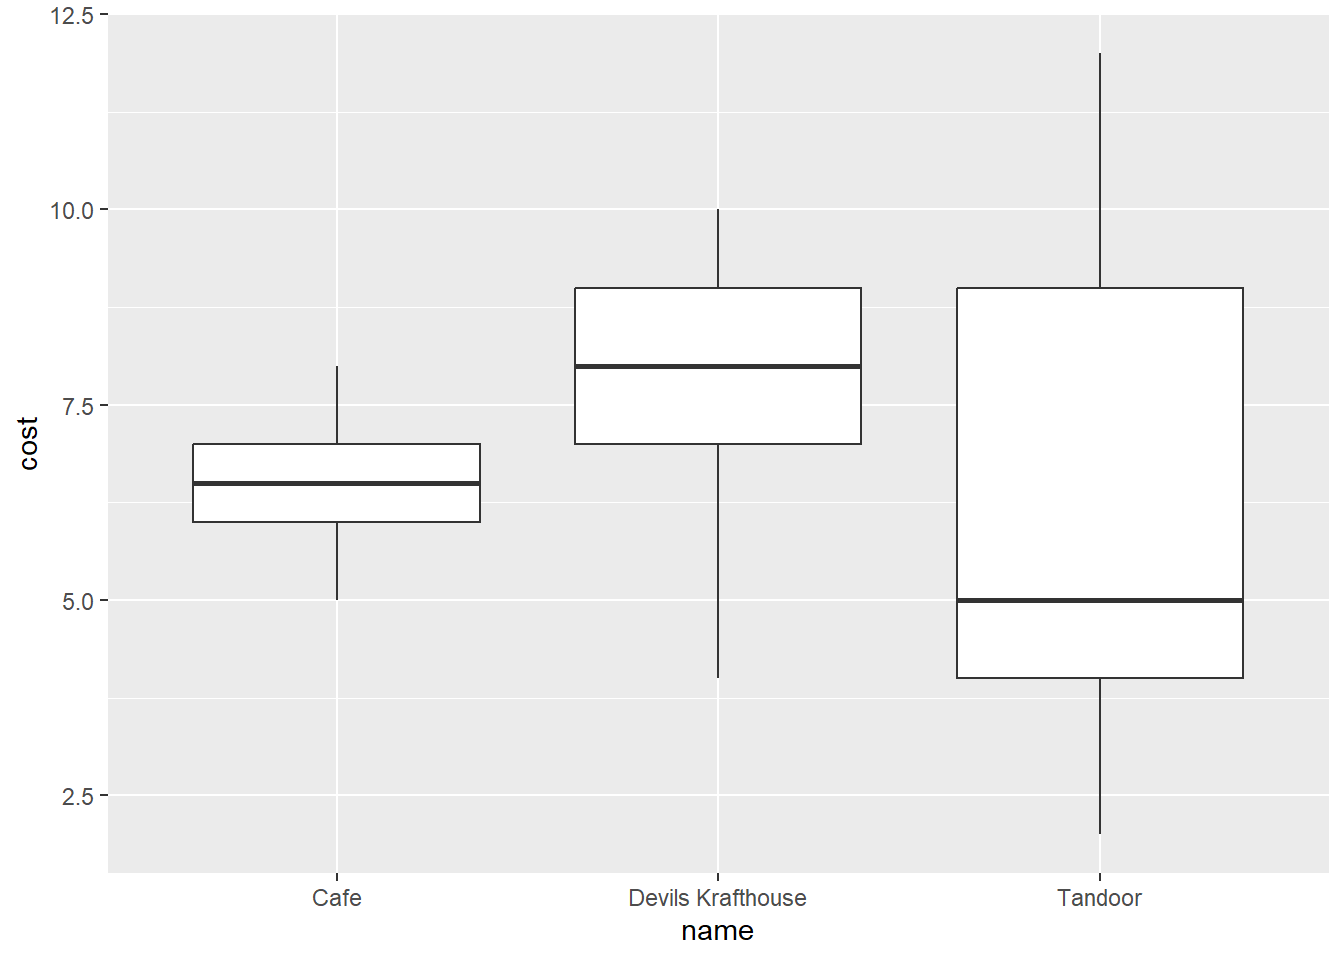
brodhead_center |>
  filter(name != "Tandoor") |>
  ggplot(aes(x = rating, y = cost)) +
  geom_jitter(aes(color = name))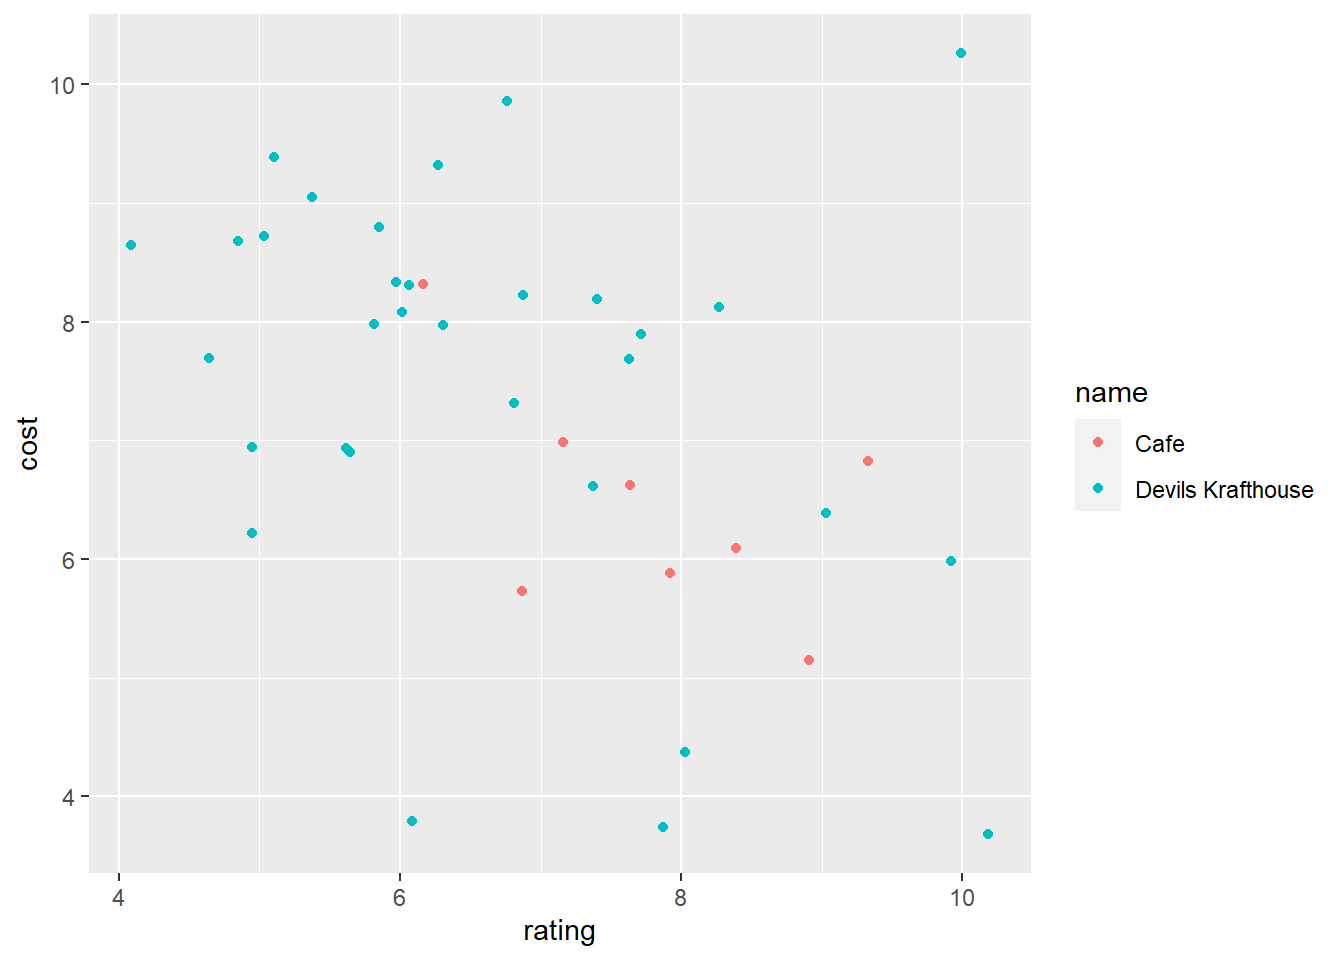
Show the code
brodhead_center |>
  drop_na(rating, cost, name) |>
  filter(name != "Tandoor") |>
  ggplot(aes(x = factor(rating), y = cost)) +
  geom_tile(aes(fill = name), alpha = .3) +
  scale_y_continuous(label = scales::dollar) +
  scale_fill_brewer(palette = "Dark2") +
  labs(x = "rating", y = NULL, title = "Heatmap: cost over ratings",
       caption = "Source: https://github.com/data-and-visualization/Intro2R",
       fill = "Restaurant name") +
  theme_classic() +
  theme(plot.title.position = "plot")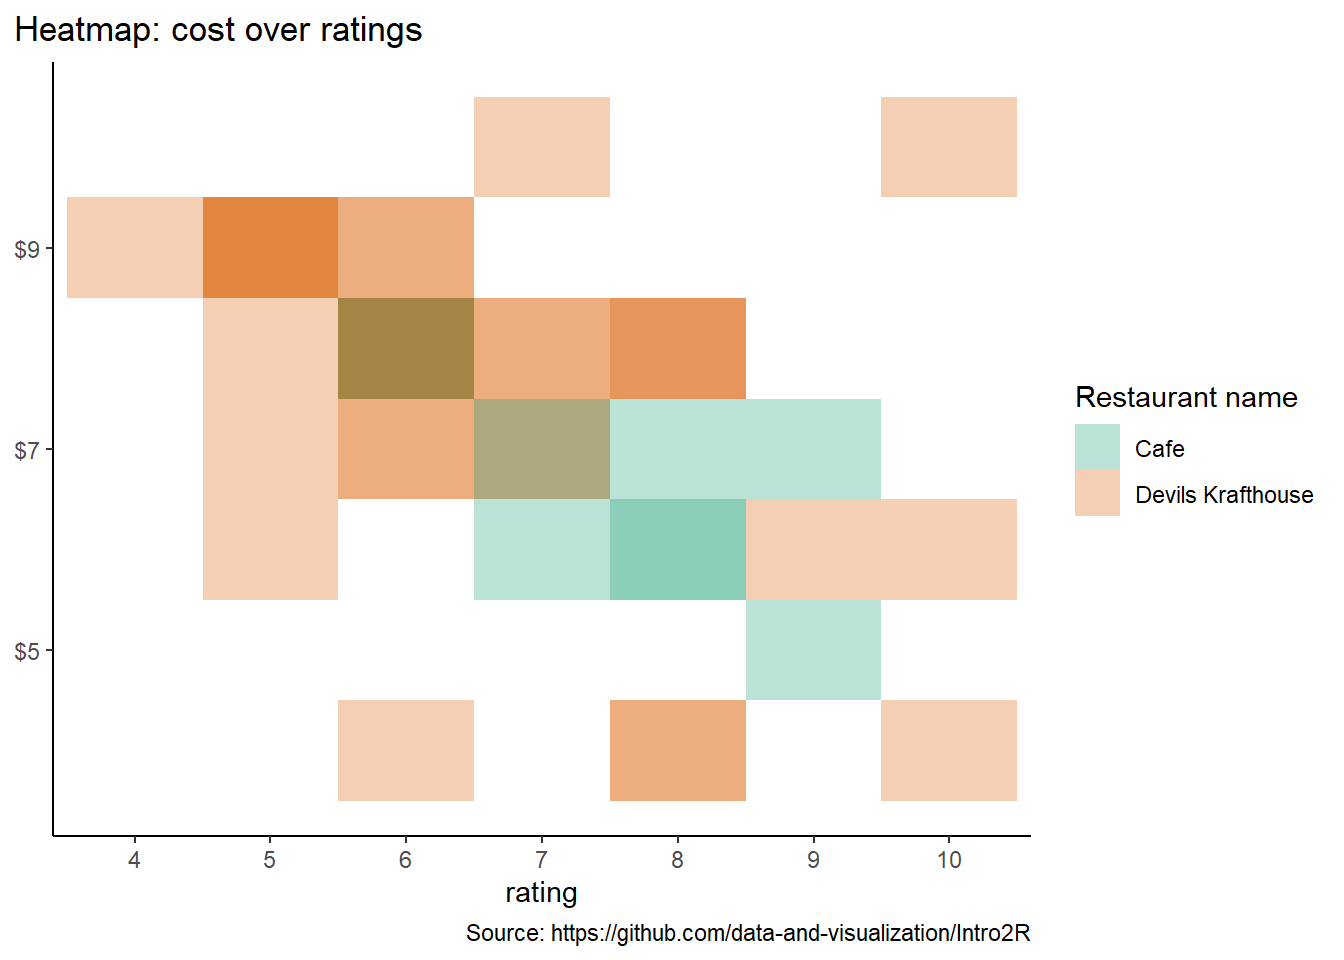
Footnotes
In R, a package is a collection of R functions, and/or data, and/or documentation. R users find and install packages via centralized package-hubs (e.g. Metacran, CRAN, Bioconductor, R-universe, Github) to aid in the specialization and efficiency of R coding.↩︎